
US CENSUS 2020 UPDATE

SPECIAL REPORT
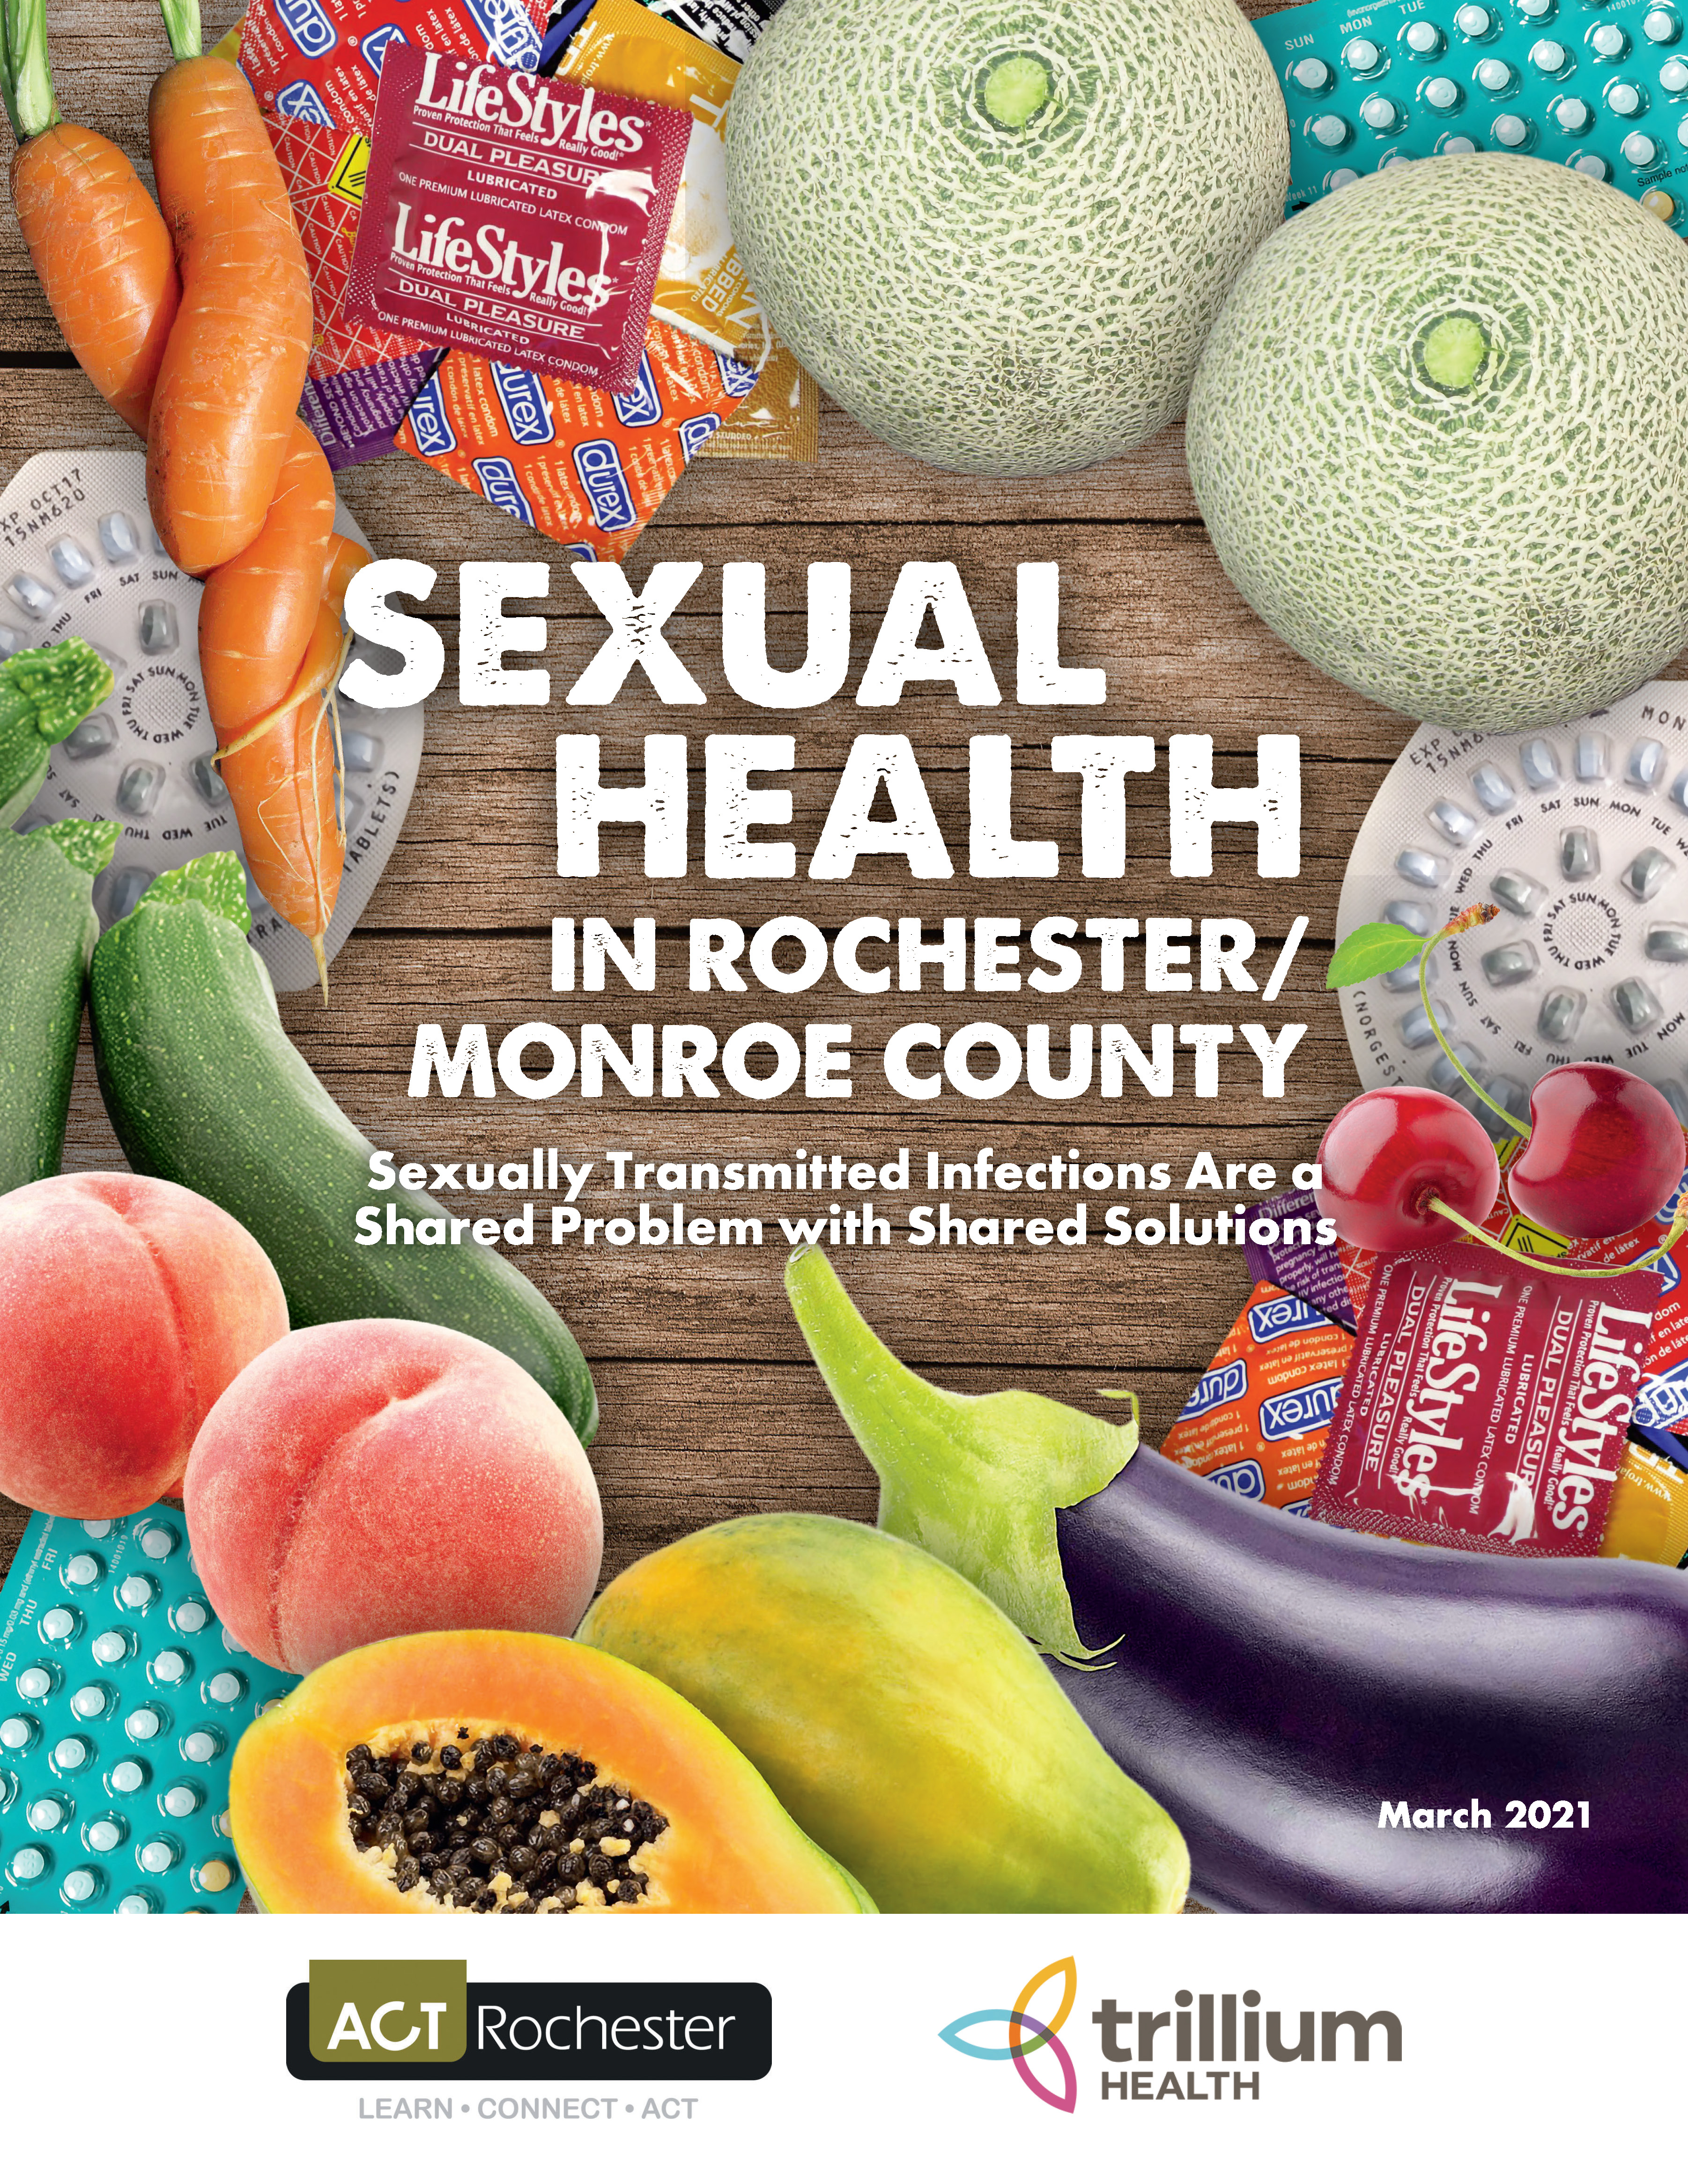
Sexual Health in Rochester/Monroe County: Sexually Transmitted Infections Are a Shared Problem with Shared Solutions
READ THE FULL REPORT


“Not everything that is faced can be changed, but nothing can be changed until it is faced.”
—James Baldwin
 Click on a geography for community-specific data


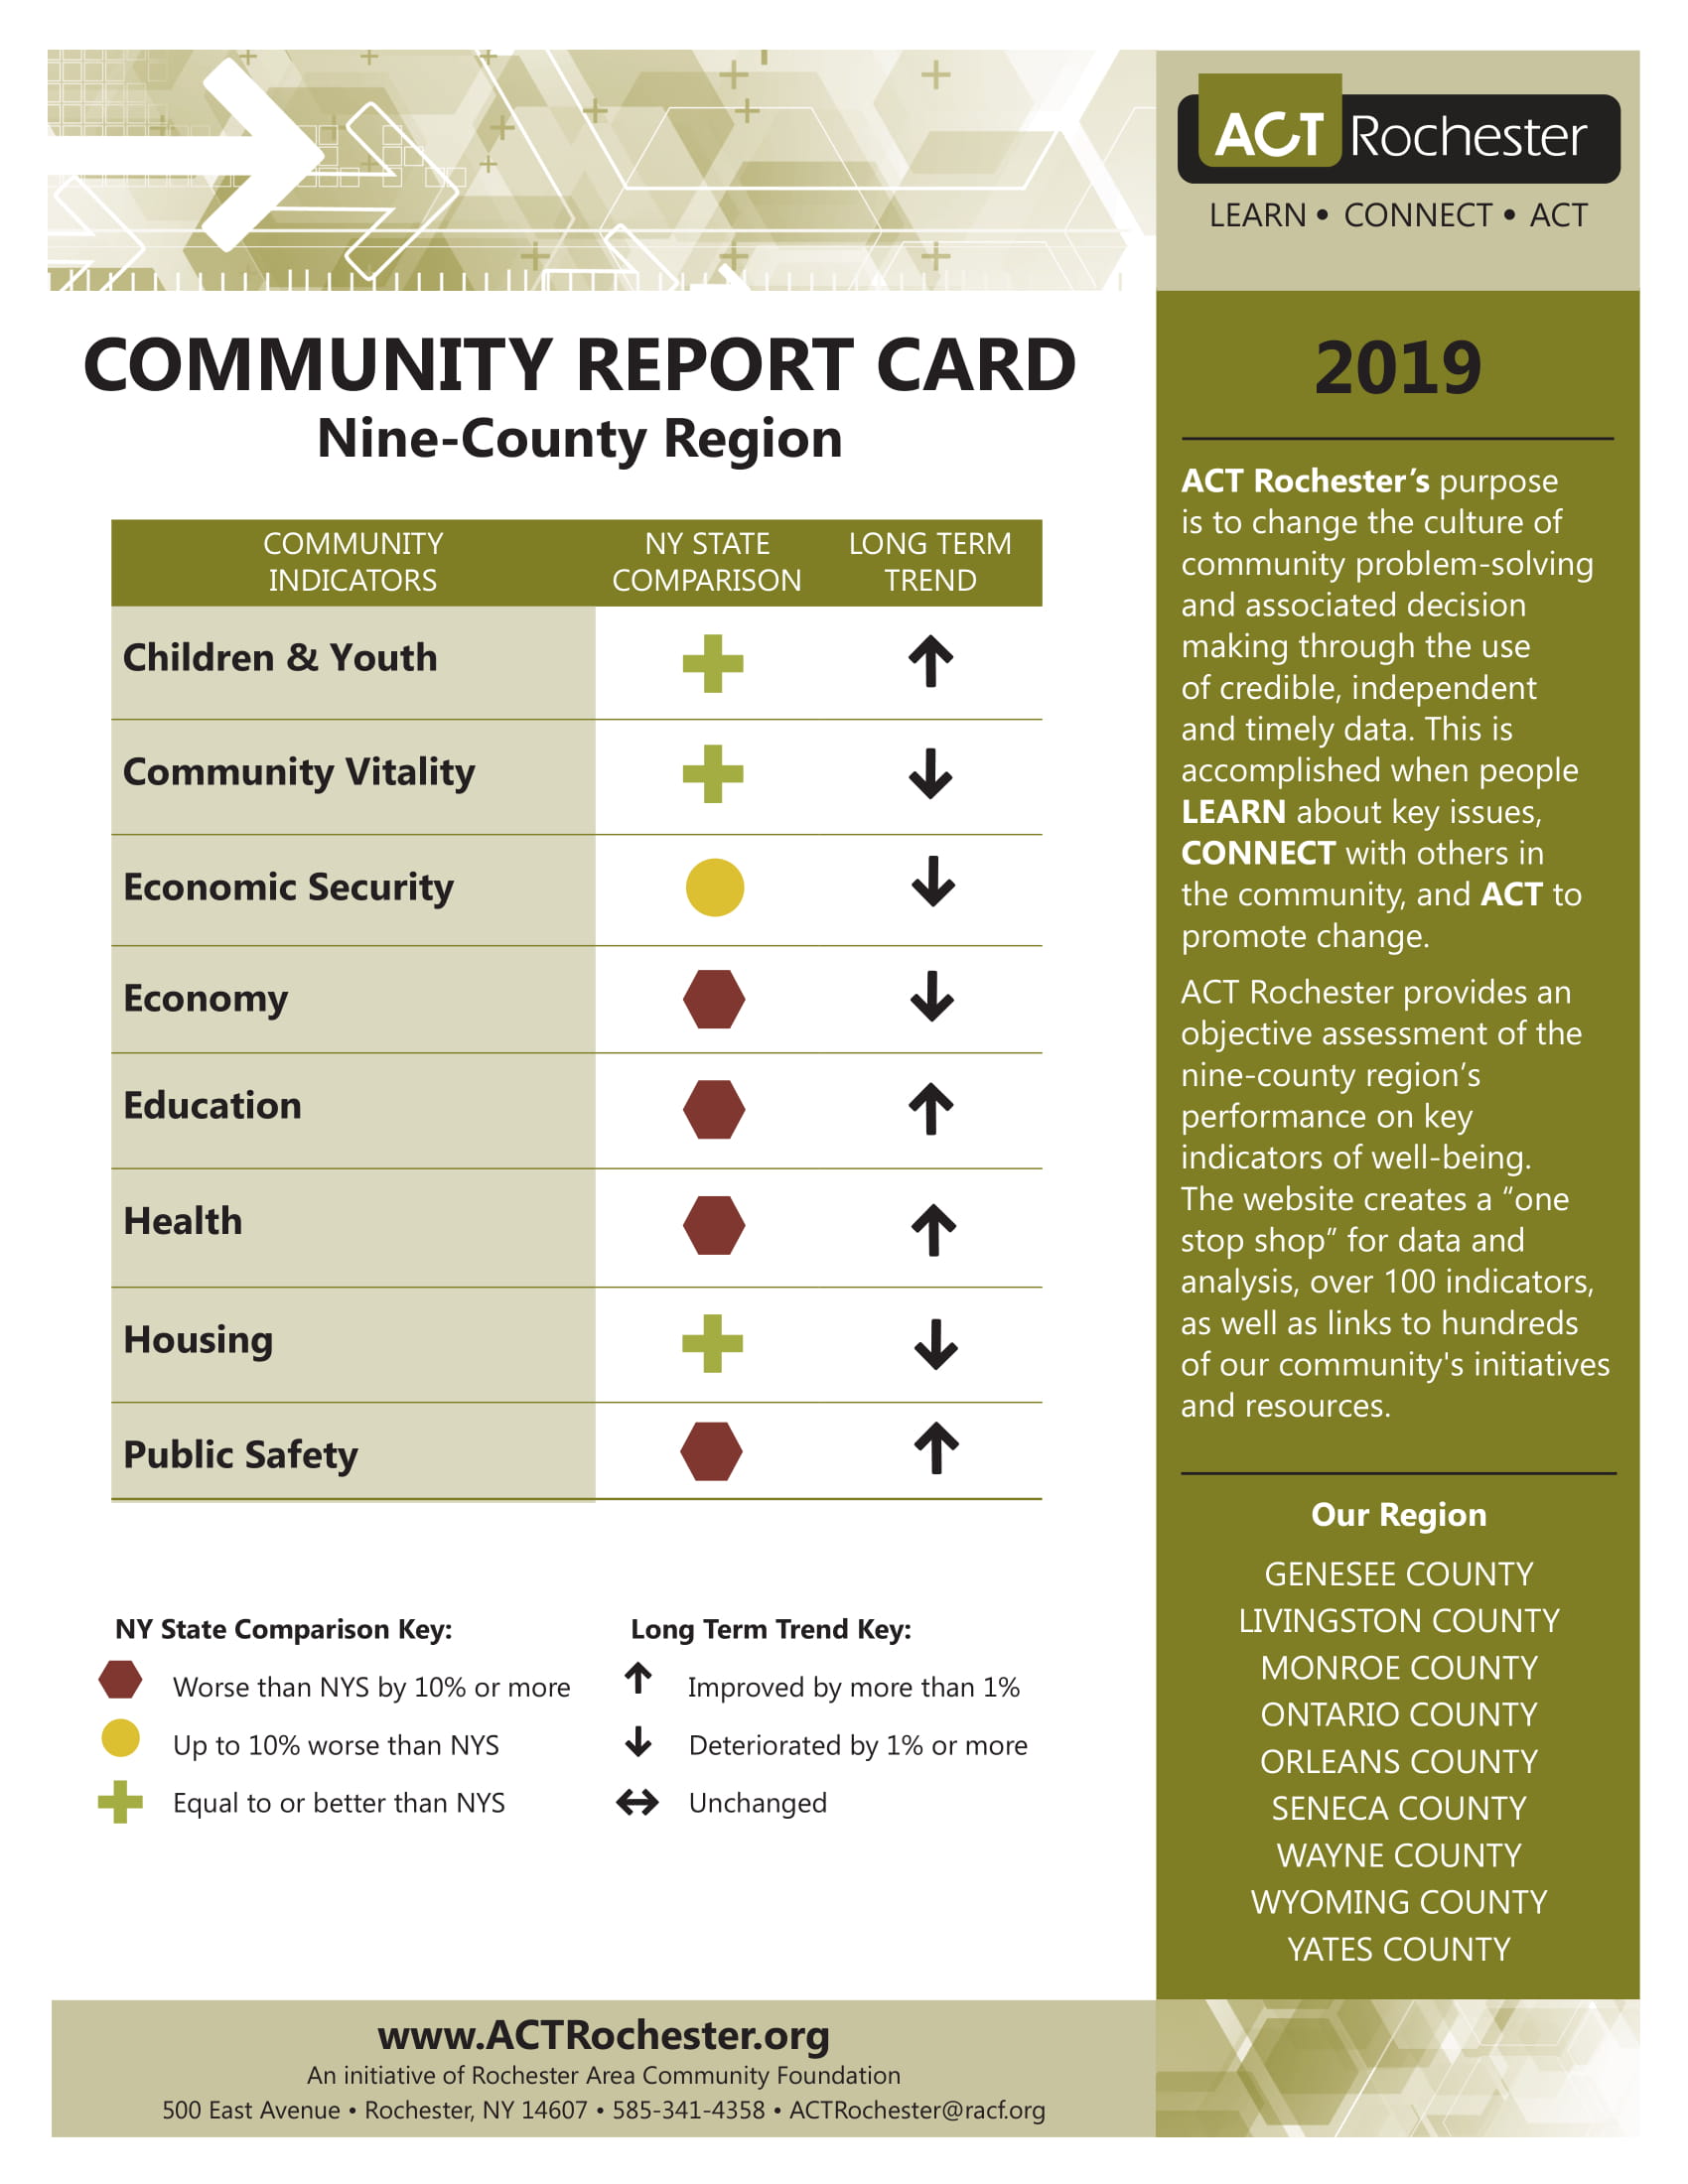

 Children & Youth
 Community Vitality
 Demographics
 Economic Security
 Economy
 Education
 Health
 Housing
 Public Safety

