Reports
The Color of Health: The Devastating Toll of Racism on Black Lives does just that. The report connects the dots between the 67% higher premature mortality rate for African Americans in Rochester and the Finger Lakes and the upstream social constraints Black residents are forced to navigate.
Marrying health data with insights from experts and lived experiences, the report documents how racism, whether deliberate or unintentional, undermines physical and mental wellbeing. It shows how biased practices limit access to well-paying jobs, safe neighborhoods, nutritious food and health care; how segregated neighborhoods and schools limit opportunities that are foundational to a child's future wealth and health; and how chronic exposure to racism has a weathering effect on the mind and body.
Click on the cover to read the full report.
In August 2020, ACT Rochester and Rochester Area Community Foundation released an updated report that documents how the status of African Americans and Latinos in the entire nine-county Rochester region significantly lags their counterparts in New York State and nationwide.
“Hard Facts Update: Race and Ethnicity in the Nine-County Greater Rochester Area” examines the substantial gaps in educational and economic outcomes among persons of different racial and ethnic backgrounds.
New in this report are ideas and resources to stimulate conversations leading to fuller understanding and community action – a process for community change - three suggested levels of learning supported by a PowerPoint Slide Presentation.
Click on the "Hard Facts" cover to read the full report.
Click here to access the Hard Facts 2020 PowerPoint Presentation.
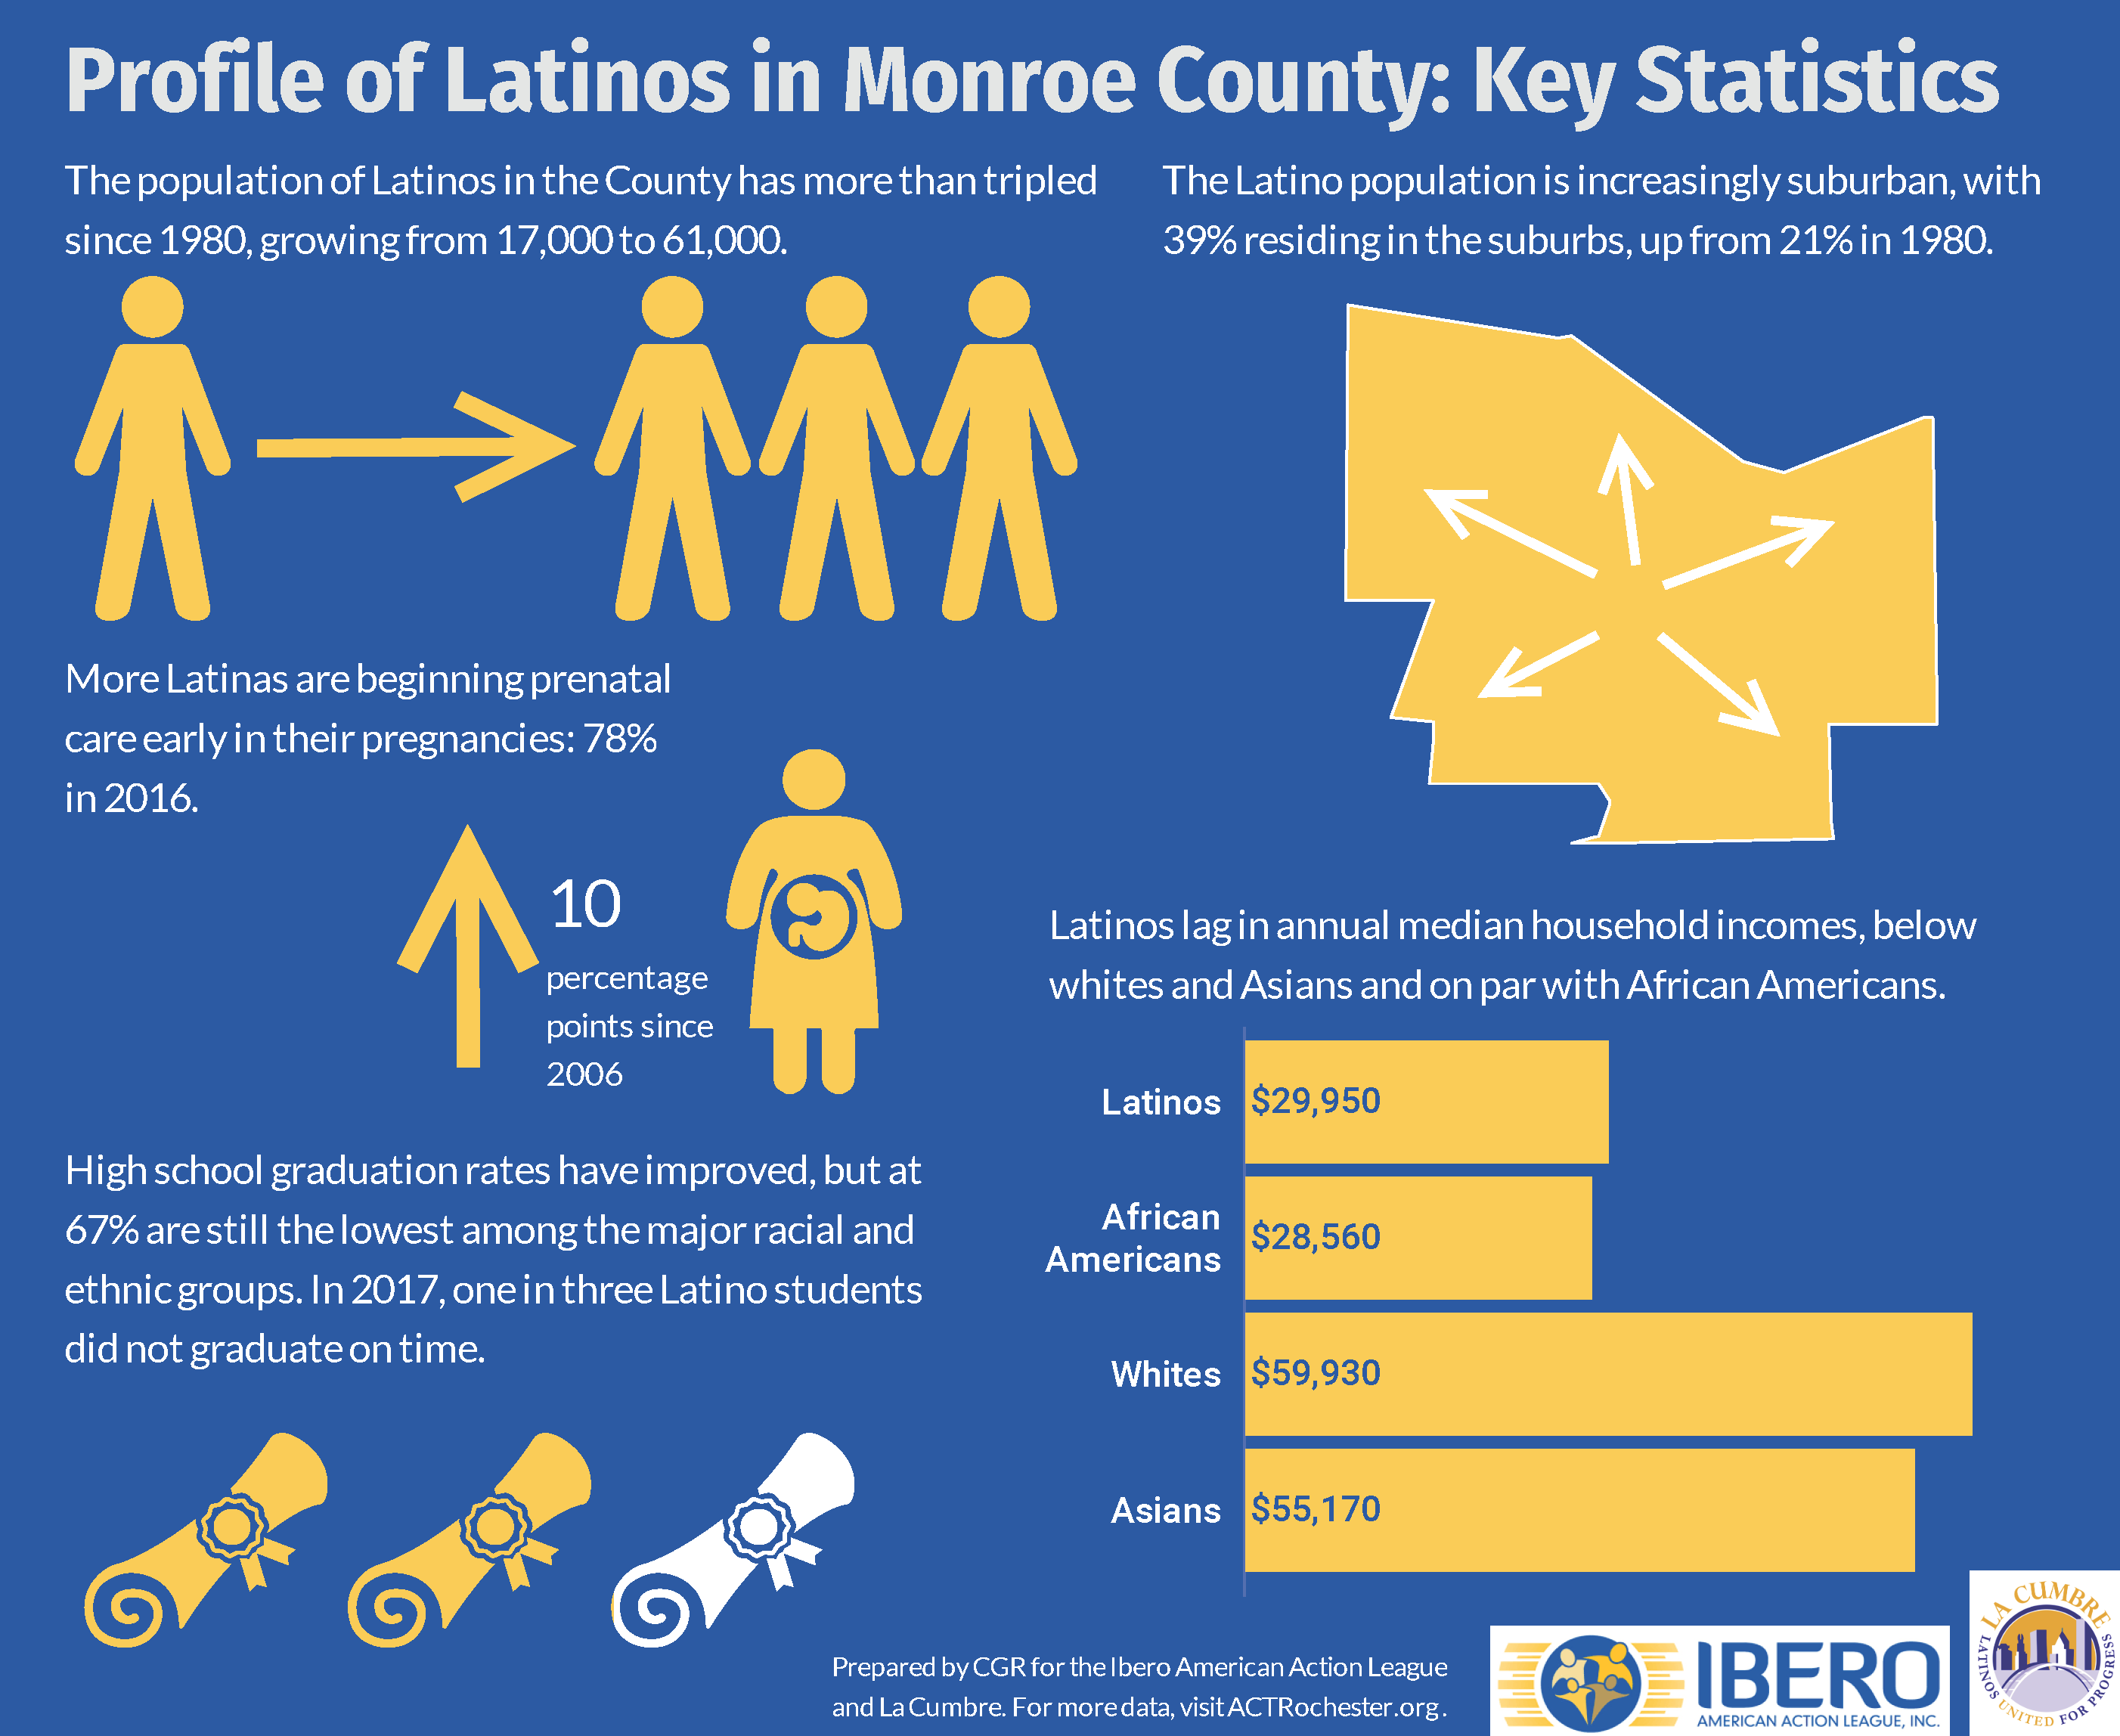
CGR was engaged by the Ibero American Action League and La Cumbre to develop this Profile of the Hispanic and Latino community in Monroe County. This report updates previous reports from 2000, 2003 and 2012 and is aimed at providing both big-picture and granular information about how Hispanic and Latino residents of Monroe County are faring on a variety of socioeconomic indicators. Highlights include:
- A majority of Hispanic residents continue to be of Puerto Rican heritage: 69%.
- Hispanic and Latino residents had the youngest population in Monroe County, with 73% younger than 45.
- A majority of Monroe County Hispanic or Latinos spoke a language other than English, though that share declined from 74% in 2000 to 63% in 2012-16.
Read the Full Report | Download the Data Tables | Access Latino Dashboard
 In August 2017, ACT Rochester and Rochester Area Community Foundation released a report that documents how the status of African Americans and Latinos in the entire nine-county Rochester region significantly lags their counterparts in New York State and nationwide.
“Hard Facts: Race and Ethnicity in the Nine-County Greater Rochester Area” examines the substantial gaps in educational and economic outcomes among persons of different racial and ethnic backgrounds.
In early 2018, two "Hard Facts" Community Workshops were held in Rochester for caring and concerned citizens in the region to learn more about the details behind the "Hard Facts" data, to confront biases and to better identify systems that keep people of different racial and ethnic backgrounds from succeeding.
Click on the "Hard Facts" cover to read the full report.
 Children & Youth
 Community Vitality
 Demographics
 Economic Security
 Economy
 Education
 Health
 Housing
 Public Safety

